
Topic: Earth Energy Density And Movement Of Plates
Earth Energy Density And Movement Of Plates
Which process of the water cycle occurs when water absorbs 2260 Joules of heat energy per gram?
(1) melting of ice
(2) condensation of water vapor
(3) evaporation of water
(4) freezing of water
During which phase change will two grams of water release 668 joules of heat energy?
(1) melting
(2) freezing
(3) vaporization
(4) condensation
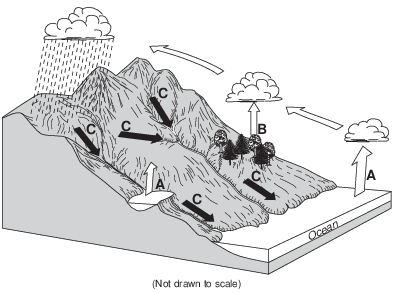
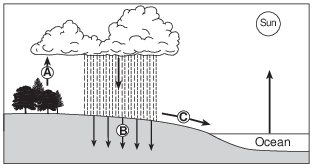
In order for process A to occur, liquid water must
(1) gain 334 Joules per gram
(2) gain 2260 Joules per gram
(3) lose 334 Joules per gram
(4) lose 2260 Joules per gram
Which change in the heat energy content of water occurs when water changes phase from a liquid to a solid?
(1) gain of 334 Joules of heat energy per gram
(2) release of 334 Joules of heat energy per gram
(3) gain of 2260 Joules of heat energy per gram
(4) release of 2260 Joules of heat energy per gram
When one gram of liquid water at its boiling point is changed into water vapor
(1) 334 J/g is gained from the surrounding environment
(2) 334 J/g is released into the surrounding environment
(3) 2260 J/g is gained from the surrounding environment
(4) 2260 J/g is released into the surrounding environment
Which process releases 2260 joules of heat energy per gram of water into the environment?
(1) melting
(2) freezing
(3) condensation
(4) evaporation
Which process releases 334 Joules (J) of energy for each gram of water?
(1) melting
(2) freezing
(3) vaporization
(4) condensation
During the process of condensation, water vapor
(1) releases 334 J/g of heat energy
(2) releases 2260 J/g of heat energy
(3) gains 334 J/g of heat energy
(4) gains 2260 J/g of heat energy
Water vapor forms a cloud of liquid droplets at location A. State the number of joules per gram of heat energy that is released into the atmosphere during this process. [1]
J/g
Allow 1 credit for 2260 J/g.
State the amount of heat energy gained by each gram of water that evaporates from the surface of the boiling water in the beaker. [1]
J/g
Allow 1 credit for 2260 J/g.
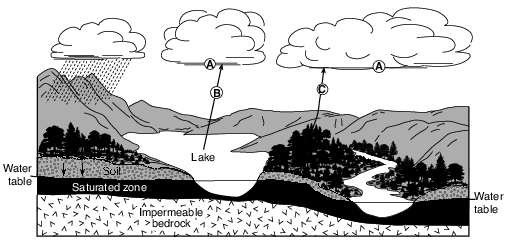
How many joules of heat energy are required to evaporate 2 grams of water from the lake surface? [1]
J
Allow 1 credit for 4520 J.
Solar Heating
Solar collectors in solar heating systems harness the power of the Sun to provide thermal energy for heating hot water and house interiors. There are several types of solar heating systems. The best system will depend on the geographic location and the intensity of the Sun. A solar heating system saves energy, reduces utility costs, and produces clean energy. The efficiency and reliability of solar heating systems have increased dramatically in recent years.
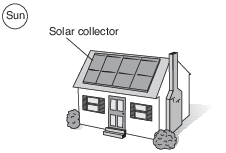
Explain why solar energy can still be collected on cloudy days. [1]
Allow 1 credit. Acceptable responses include, but are not limited to:
• — Clouds only reflect some of the Sun’s energy back into space.
• — Some radiation still gets through to Earth’s surface.
Identify the primary factor that causes location C to have a colder climate than location D. [1]
Allow 1 credit. Acceptable responses include, but are not limited to:
• — elevation
• — altitude
• — height above sea level
• — Location C is on the top of a mountain.
• — Location D is at a lower elevation.
• — C is located in the mountains.
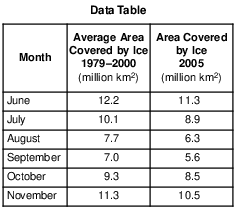
Scientists have noted that since 2002, the area of the Arctic Ocean covered by ice during these warmer months has shown an overall decrease from the long-term average (1979–2000). State one way in which this ice coverage since 2002 and the ice coverage shown in the 2005 data above provide evidence of global warming, when compared to this long-term average. [1]
Allow 1 credit. Acceptable responses include, but are not limited to:
• — The area covered by ice in 2005 was less than the average area covered by ice from 1979 to 2000.
• — The area covered by ice was less, showing evidence of global warming.
• — More ice melted in 2005 than the average that melted from 1979 to 2000.
• — The ice caps were melting, causing less surface ice in 2005.
• — There was less ice in 2005.
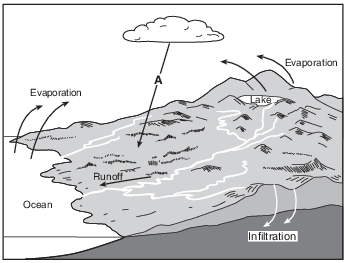
What is the main source of energy for the water cycle? [1]
Allow 1 credit. Acceptable responses include, but are not limited to:
• — the Sun
• — insolation
• — solar radiation/solar energy
• — sunlight